COVID-19 vaccinations in France – data visualization and analysis

THE NEED
This project “COVID-19 vaccinations in France” was conceived to provide French citizens and decision makers with effective data visualization on the ongoing vaccination campaign, helping to understand its evolution and impact.
Further evolution of the project expected in the following months will exploit also data about the vaccine allocations by laboratory for each department and vaccination center (Packaging unit vs doses) and the analysis of Covid-19 infection curves for those already vaccinated (1st and 2nd injection).
THE APPROACH
The project is realized with KNOWAGE Community Edition 7.2.16, hosted on premise on 2 VMs of 4 cores and 8 GB of ram (1VM for KNOWAGE and 1 VM for the database). The open data about the vaccination campaign are taken from opendata.gouv.fr. Data are retrieved daily and mapped by Talend jobs to feed database needed for KNOWAGE. In KNOWAGE, specific queries extract data from tables and power the dashboards.
THE SOLUTION
KNOWAGE is the business intelligence suite chosen for the realization of this project on the vaccination plan in France in reason of its openness and its broad utilization in the health sector. In addition, the power and functional richness of KNOWAGE will support the next steps of this project, evolving from an analysis on factual data of a standard BI project, toward the analysis of big data and the realization of predictive analyses by integrating machine learning algorithms.
At the moment, two different interactive dashboards have been realized.
COVID-19 VACCINATION CENTERS AND APPOINTMENTS (3 tabs):
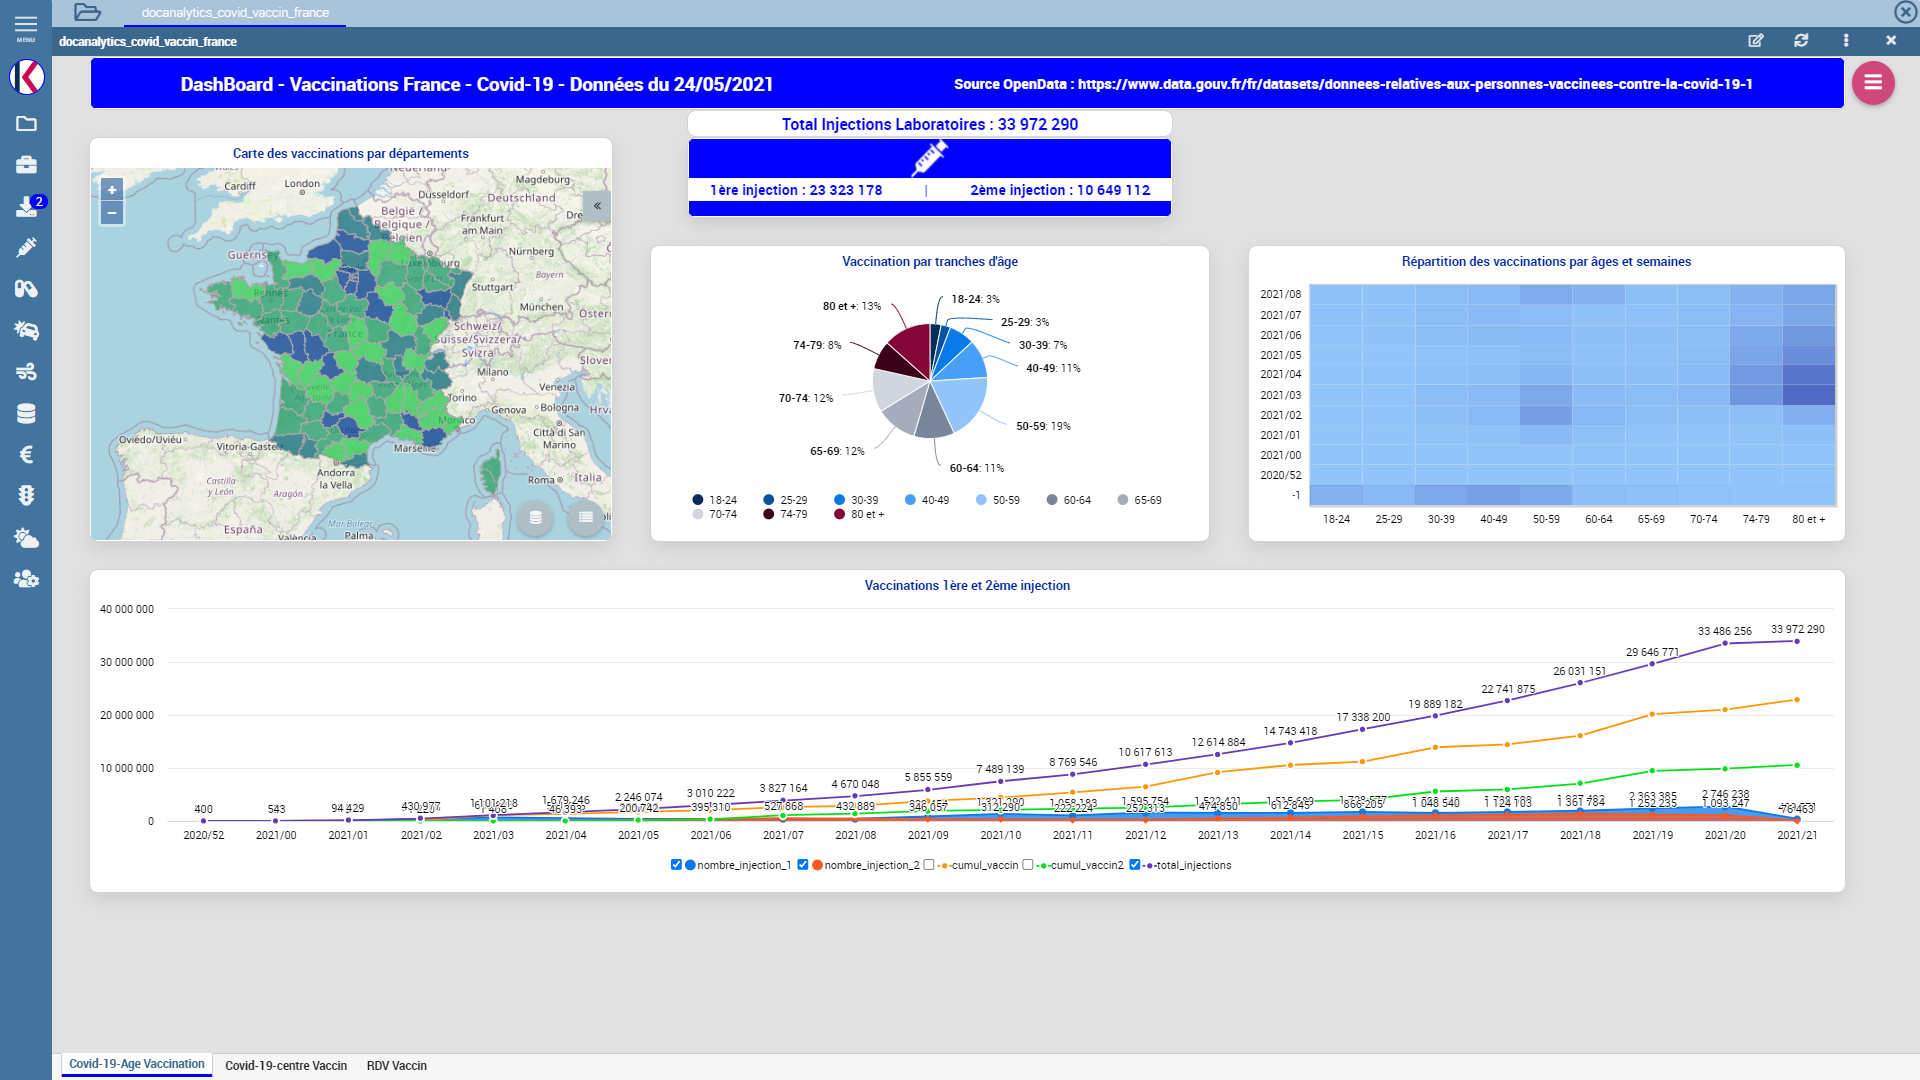
This view shows the breakdown of vaccinations carried out in the different age groups and in the different departments. The line chart shows the temporal trend of the number of vaccinations with first dose, second dose and total injections.
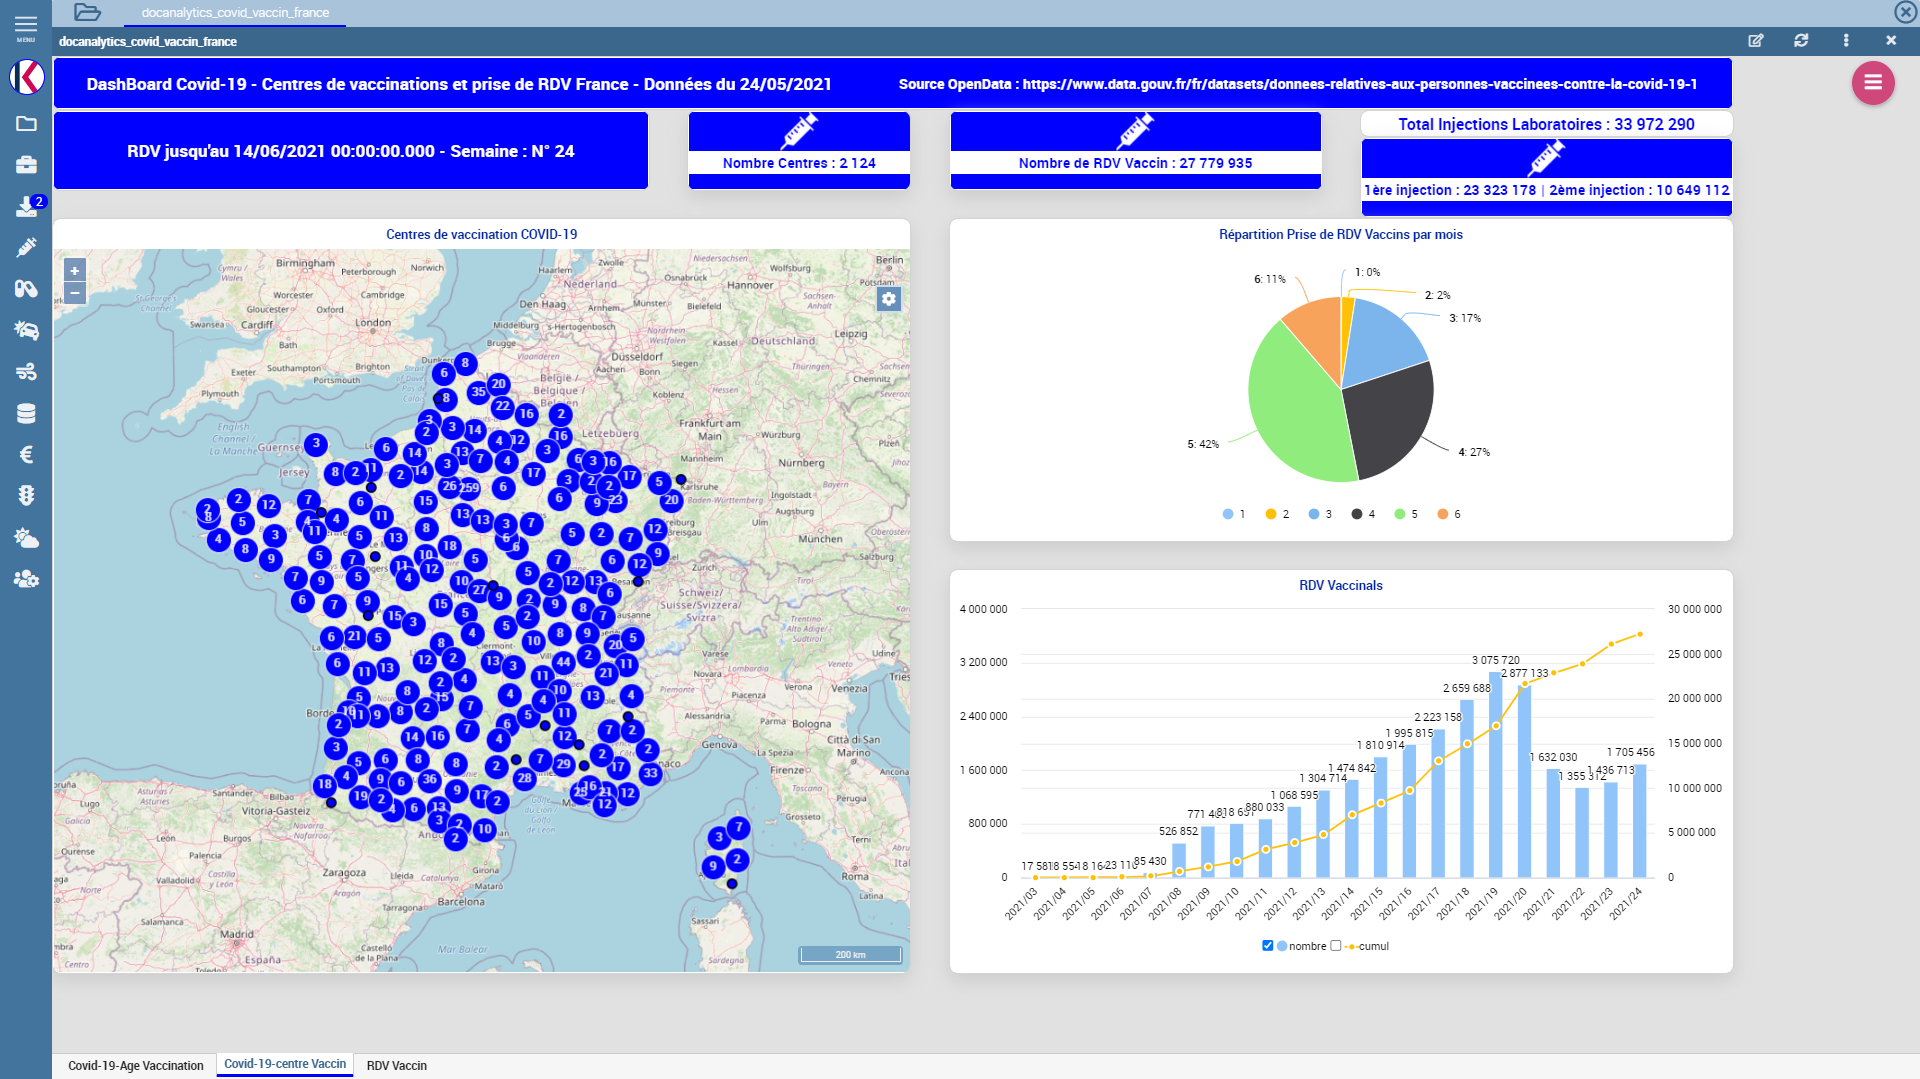
This view identifies the different vaccination centers of the departments. For each center, it is possible to visualize the temporal progression of number of appointments.
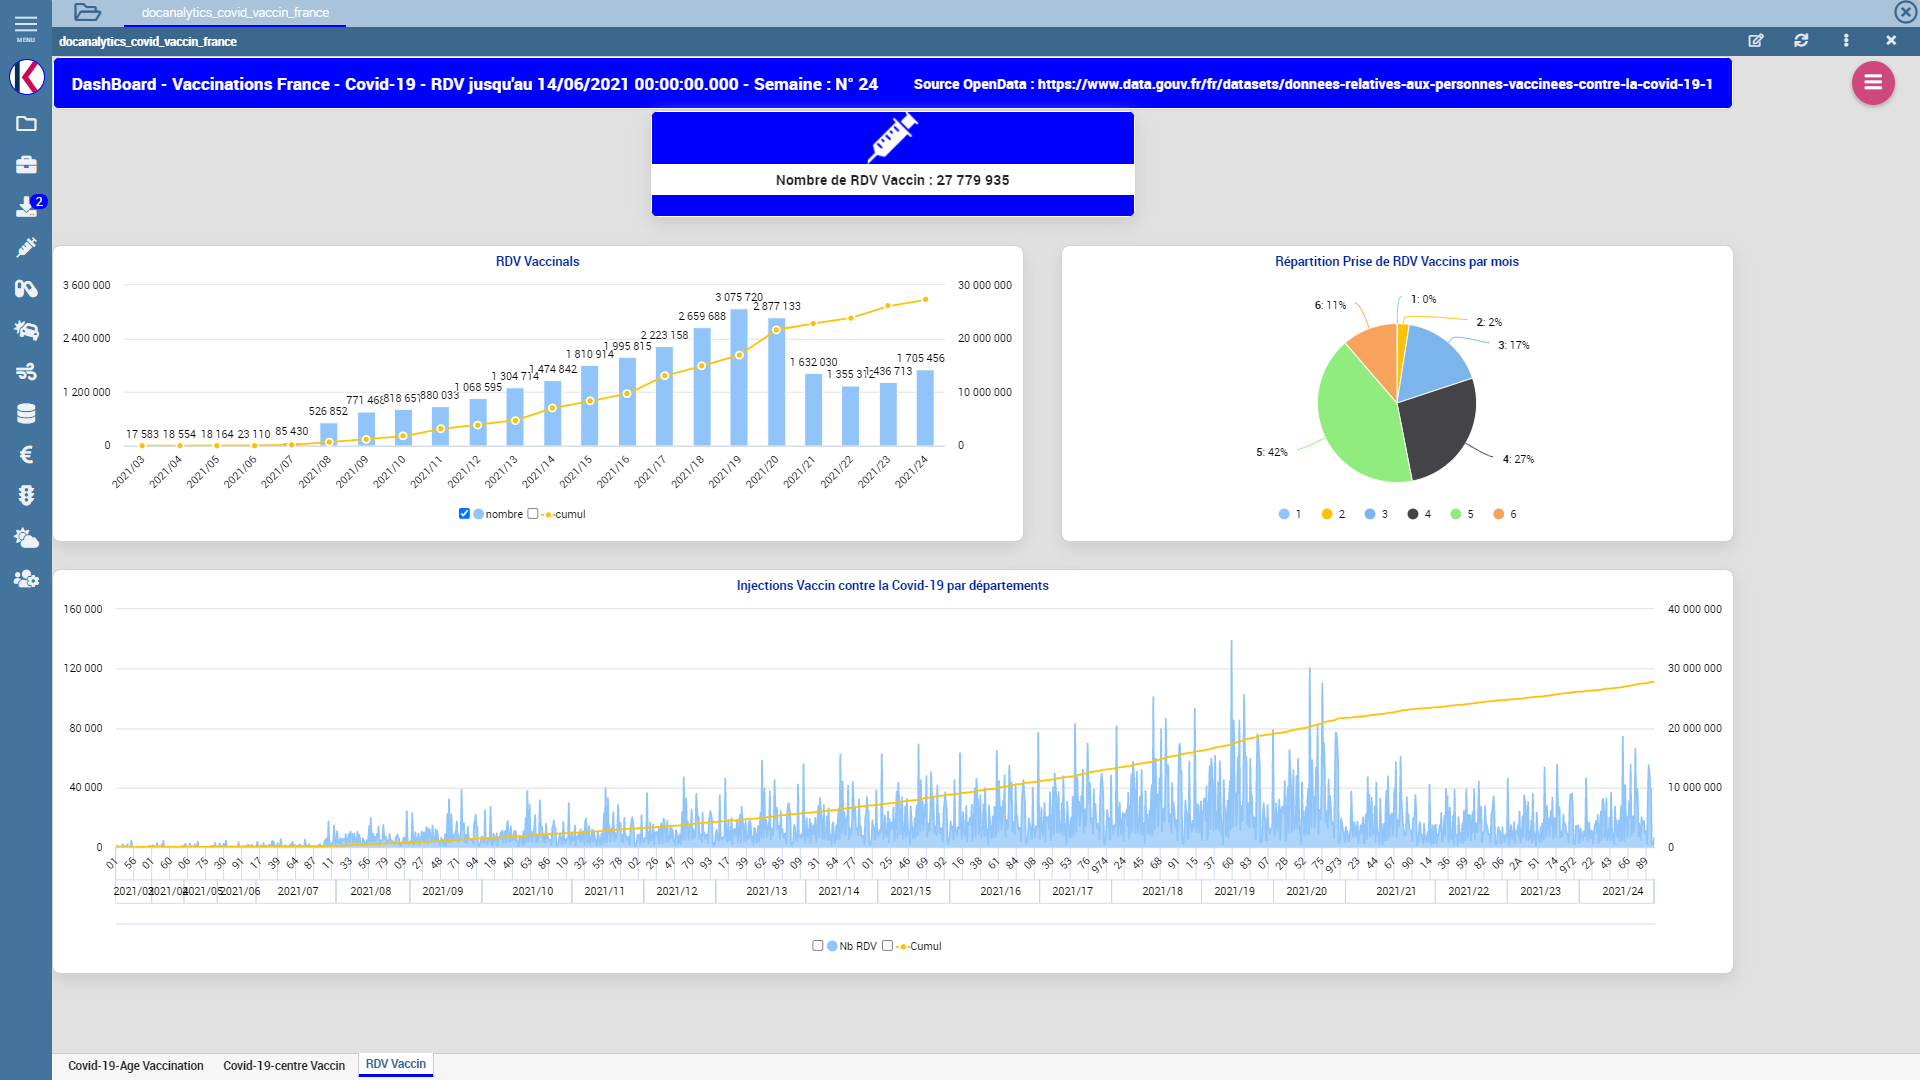
This view allows analyzing the number and distribution of appointments for each department, for each week and for each month.
COVID-19 VACCINE INJECTIONS FOR EACH LABORATORY (2 tabs):
Laboratories: PFIZER / BIONTECH, MODERNA, AstraZeneca, JANSSEN
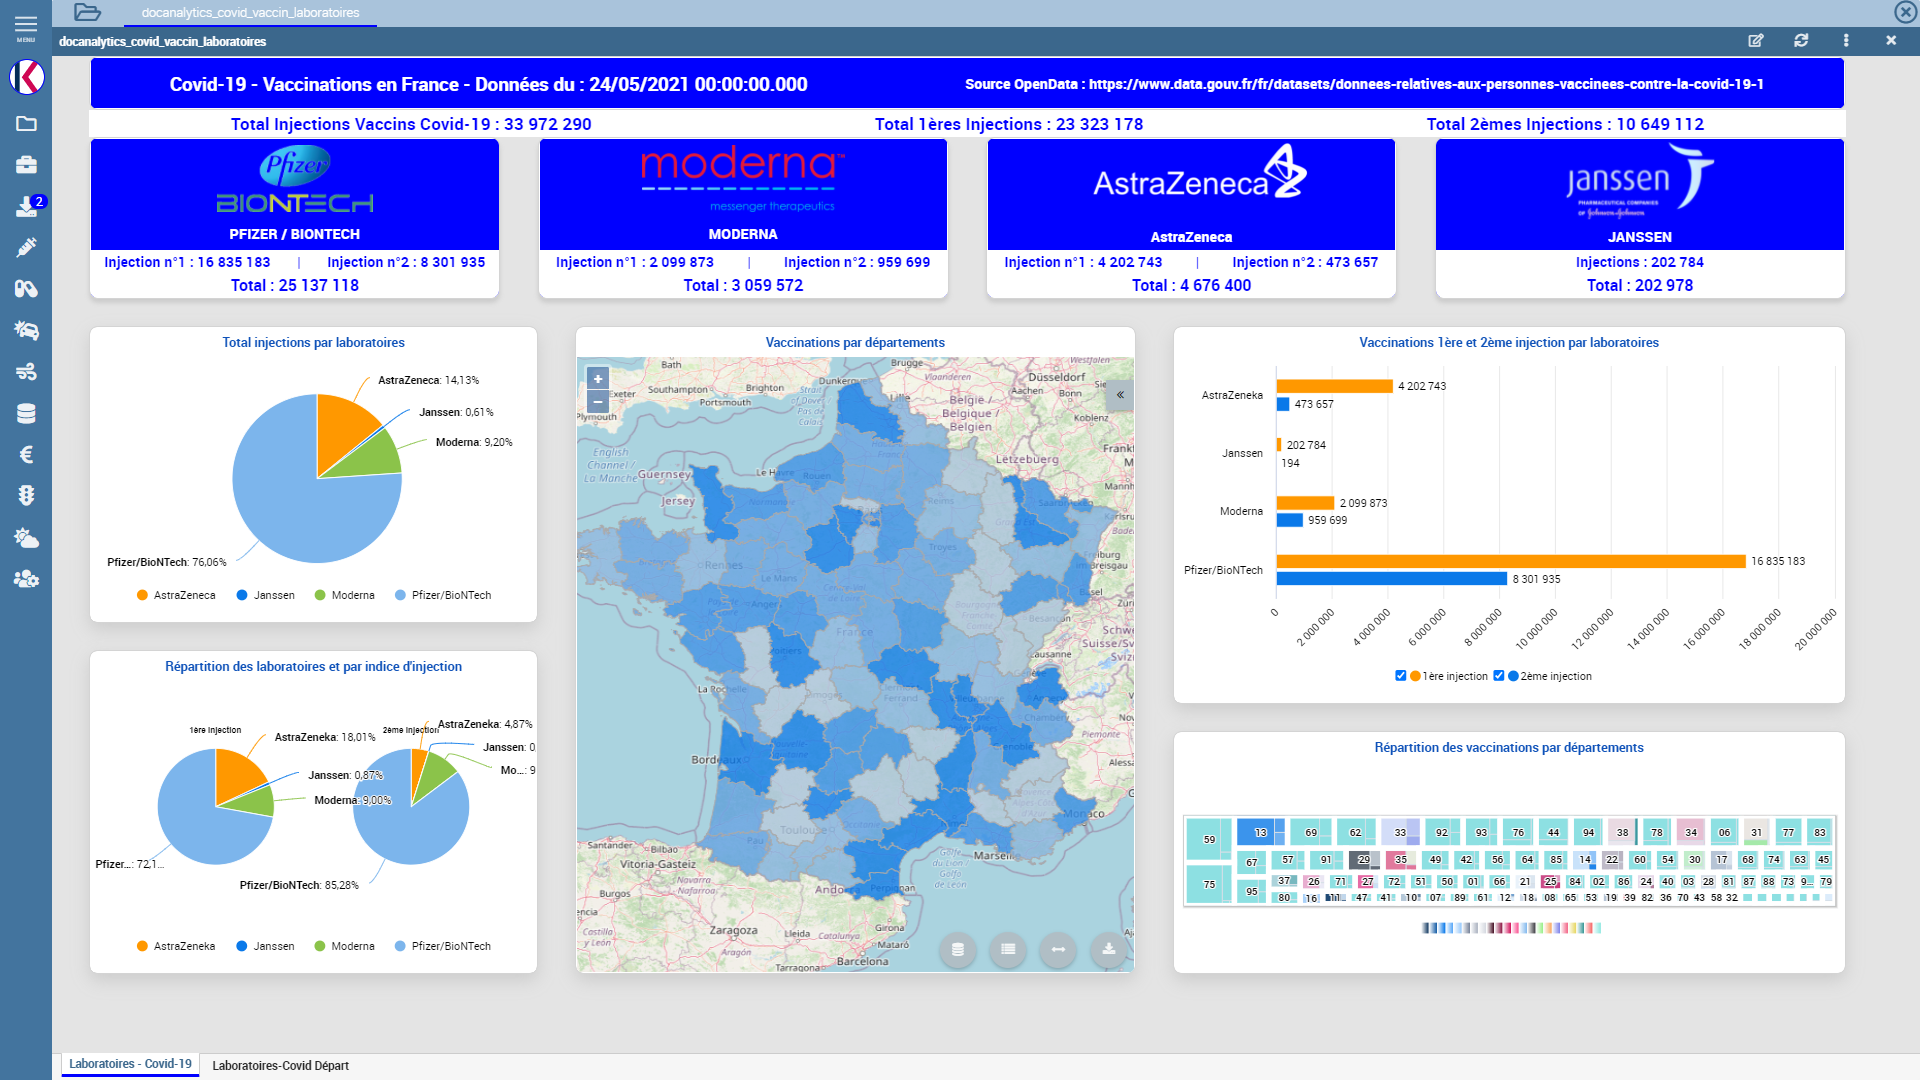
This view shows the administration percentages of the vaccines of the different laboratories, distinguishing between first and second dose. It is possible to filter results according to a specific department.
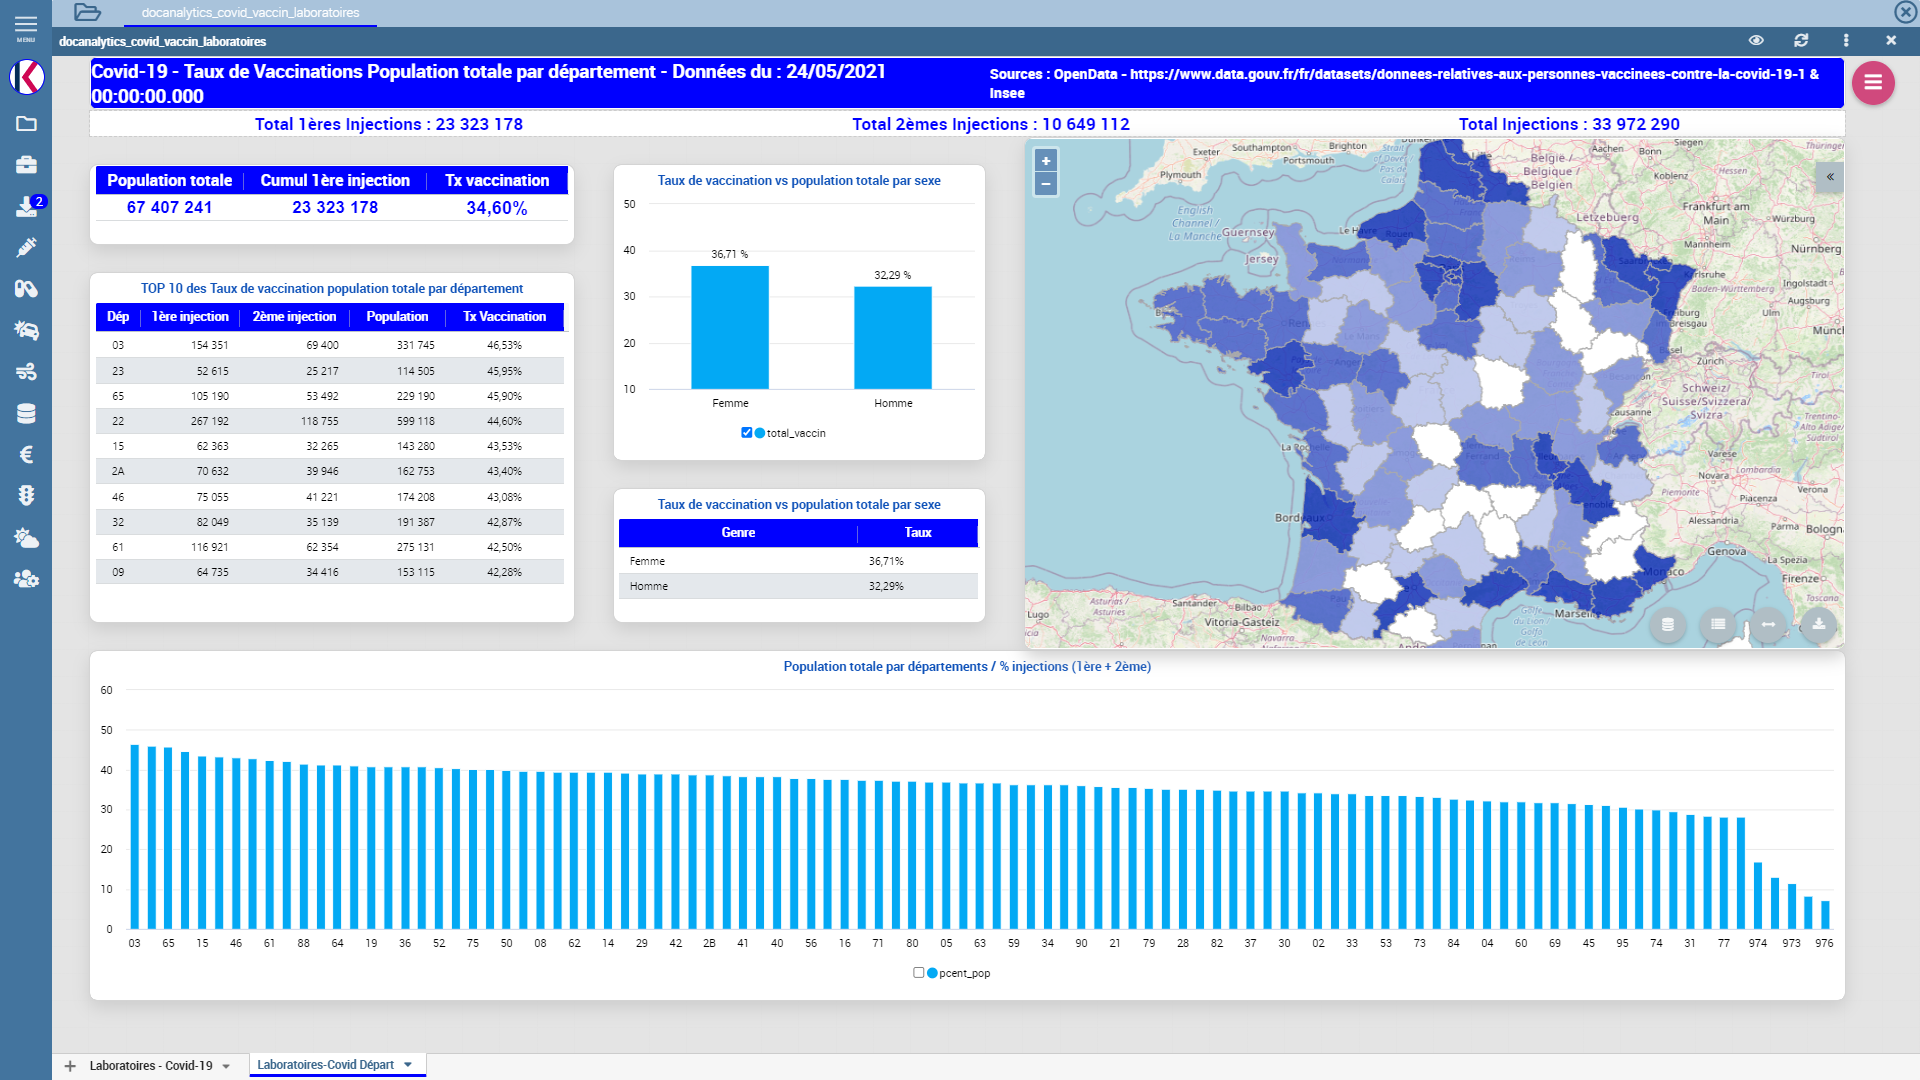
This view shows the vaccination rate with first and second dose for each department in relation to its population. The bar chart breaks down vaccinations by gender.
STATUS OF THE STOCKS OF VACCINES:
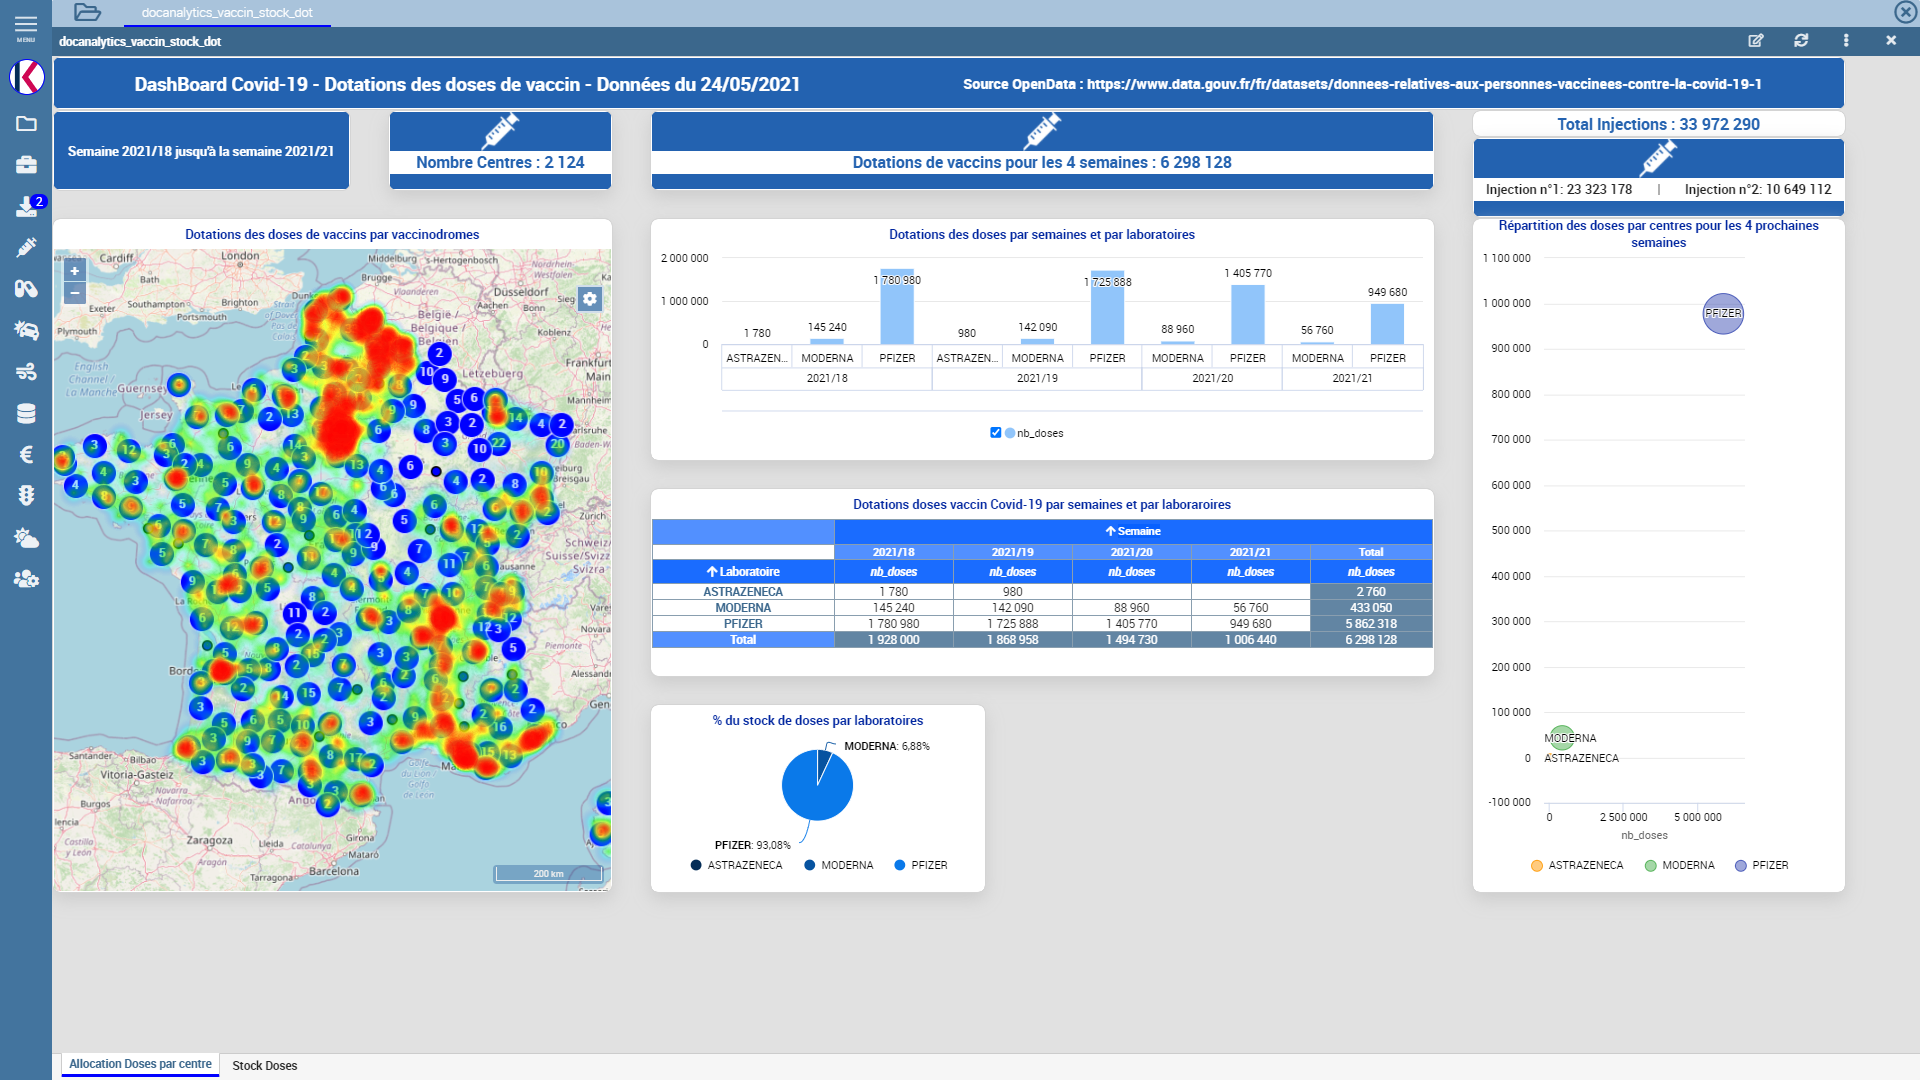
This view shows the stock of doses from the different laboratories and their allocations for the next 4 weeks. The map displays the status of stocks of doses in the various mass vaccination sites.
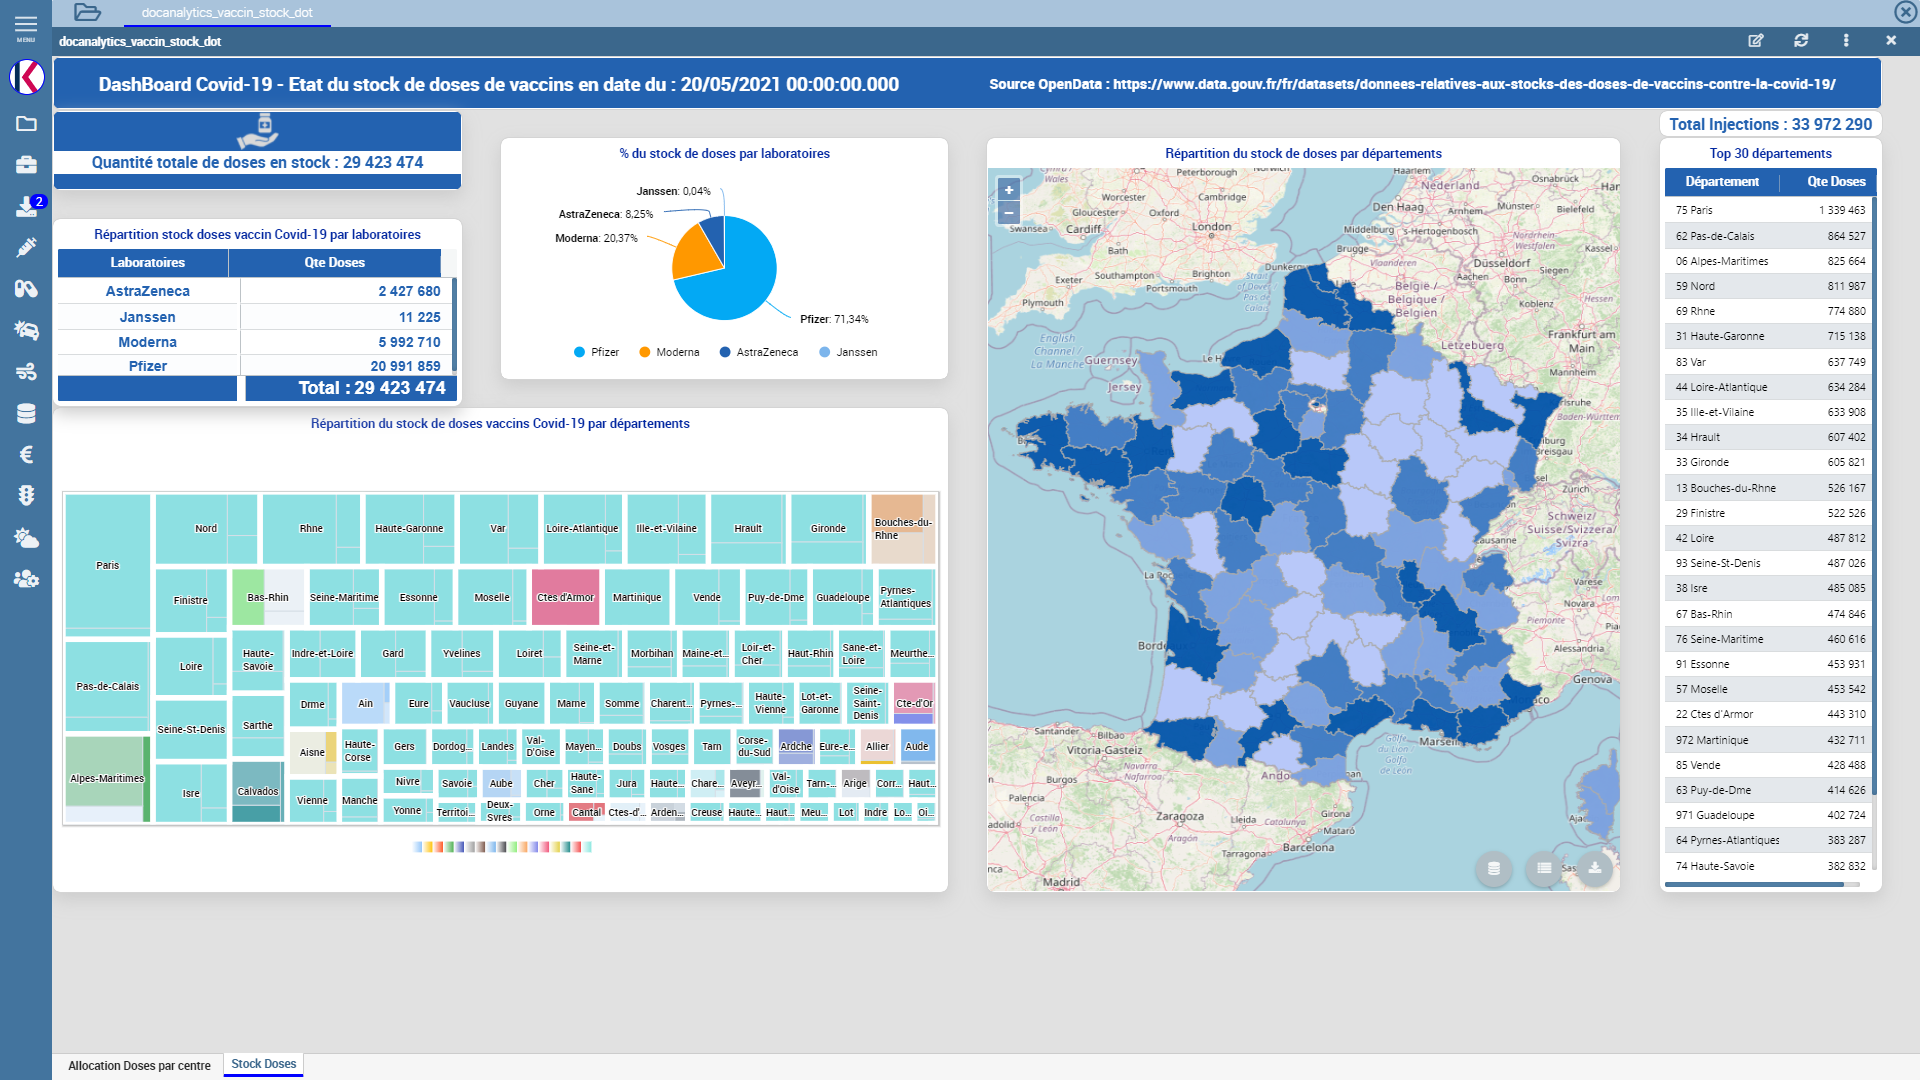
This view analyzes the quantity of vaccine doses of the various laboratories currently available in stock in France and in the individual departments. A table lists the top 30 of departments with the highest number of injections in relation to its population.

Guilhem JUERS – Data and e-health pre-sales consultant at Docaposte
“The use of KNOWAGE Business Intelligence suite for the realization of this project was natural because of its flexibility and scalability. KNOWAGE remains in the philosophy of SpagoBI while having greatly evolved since version 6. The power and functional richness of this suite make it possible to cover all the needs of analysis. Version 8, expected in early summer 2021, goes even further towards the direction of data management for use in self-care.”