Welcome to Knowage Q&A, where you can ask questions and receive answers from other members of the community.
0 votes
1 view

Hi,

i am currently evaluating Knowage and therefore installed the last version (7.0.0) on our Ubuntu 16.04 Server.
I sucessfully setup knowage, connected to a test database and created some datasets.

While creating some charts on the cockpit I stumbled on the issue of grouping data. For example:

I have a dataset containing working hours of employees (date (MySQL Date), employee-number (Int), hours (double).
I want to create a bar chart, that shows the summed workiung hours per employee per month. Therfore the data needs to be grouped by employee-number and then by the moneth of the date.

How can I achieve this?

In the documentation it says there should be a menu called Datetime and Grouping ../../_images/image100.png

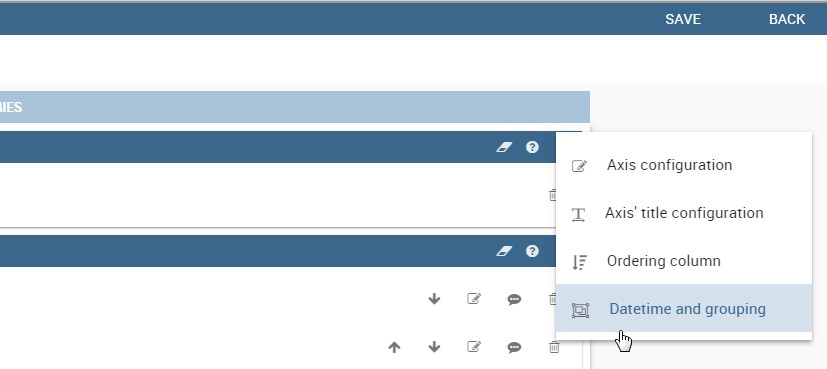
However, there is no such menu in my installation:

Knowage 7.0.0 bar chart configuration menu

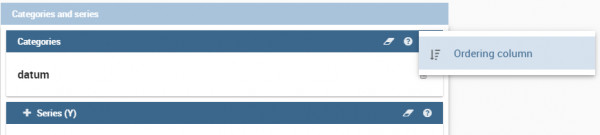
Do I need to activate something?

Thank you in advance,
best regards

Environment Knowage 7.0.0, Ubuntu 16.04 LTS, Apache Tomcat 8.5.43, Chrome 78.0.3904.108
in Charting by (130 points)
Hi Rudolf, did you install the highcharts javascript library? It is not free for commercial use, but totally worth it. You can find more information here: https://www.knowage-suite.com/qa/3636/cockipt-legend-with-error-in-6-3-1

1 Answer

0 votes
How can I use the version of the highcharts that comes with the installation of the knowage, when I use the version obtained by the docker?
by (1.1k points)

You can do it during Knowage CE installation. You will be prompted to choose the charting tool you want whether Chart.js or Highchart.js

more information here

https://www.knowage-suite.com/qa/5218/how-can-i-load-sample-data-in-version-7-1-in-linux

...