Welcome to Knowage Q&A, where you can ask questions and receive answers from other members of the community.
0 votes
1 view

Hi , I'm Creating barchart with time as value being plotted in Y-Axis using BIRT Report Designer.
Upon creation, this error shows.

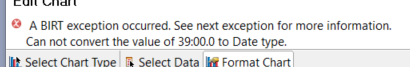
I changed it's data type in Dataset and made it to "HH:mm:ss". I re-configured the chart and it's datatype in data binding to "Time", but still, same error appears.
After a couple of days, report are now okay without me changing anything(but still gets the same error when re-creating in new template).
The only problem is, the X-Axis value are missing upon uploading the template to knowage.
Report is okay upon generating in Birt Web Viewer. Please see image below.

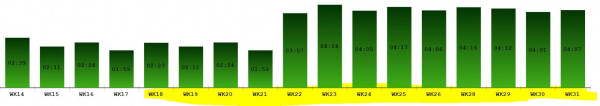
Highlighted are the missing x-axis values, and WK14 to WK17 are the only values being shown in Knowage.

Is there something to do with dataset/configuration ?

Really need help with this, if you have any idea, please let me know!Thank you in advance !

Environment Knowage 7.1.5, Windows 10, Google Chrome
in Cross Navigation by (380 points)

1 Answer

0 votes

Hi Samantha,

to help you to solve the issue related to the wrong shown data I first need to know if the dataset you're using to design your chart is declared inside the Birt Designer or you're using a dataset created on Knowage server and then called inside the Birt designer. Then I would like to know if there are any parameters and/or defaults values. 

For the error message occuring inside the chart designer I suggest you to check the field type in 3 spots: inside the dataset, the binding of the chart, the declaration of the y-axis.

Regards,

Nunzia

by (3.1k points)

Hi  n.marotta  , thank you for your response, 
I am using a dataset created in Knowage server that is being called inside the Birt Designer.
For Isolation, i did not put any parameters and just using default values.

 ***I suggest you to check the field type in 3 spots: inside the dataset, the binding of the chart, the declaration of the y-axis. 
     ---> already changed binding of the chart and declaration of the y-axis to "time" & "datetime", maybe i should try other time conversion in my dataset.

as of the moment this is what i use,  


,Convert(nvarchar(10),ENDTIME,103) AS [ENDTIME]​

and got this format as result :   00:00:00


Thank you again, will try to isolate more, sorry for late reply.

...