I'm trying to get a stacked bar graph with no luck (quite easy in a spreadsheet).
My dataset send this data:
| A12 | 1872000 |
| A51 | 1123200 |
| A52 | 748800 |
| A53 | 262080 |
| A20 | 486720 |
| A19 | 1385280 |
| A54 | 253094,4 |
| A55 | 126547,2 |
| A22 | 107078,4 |
| A56 | 1764921,6 |
| Aq22-a | 5353,92 |
| Aq22-b | 64247,04 |
| Aq22-c | 37477,44 |
I need to get this kind of graph:
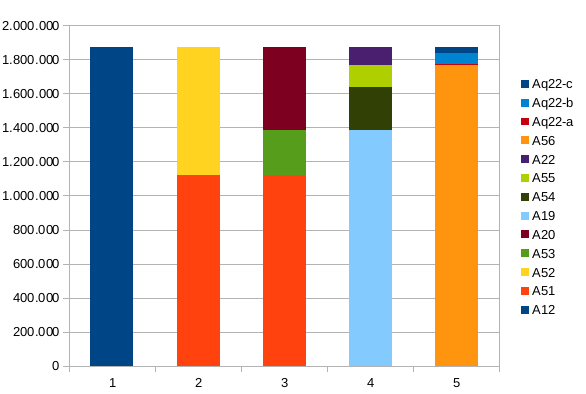
To get this I arrange the data this way.
| 1 | 2 | 3 | 4 | 5 |
| A12 | 1.872.000 | | | | |
| A51 | | 1.123.200 | 1.123.200 | | |
| A52 | | 748.800 | | | |
| A53 | | | 262.080 | | |
| A20 | | | 486.720 | | |
| A19 | | | | 1.385.280 | |
| A54 | | | | 253.094 | |
| A55 | | | | 126.547 | |
| A22 | | | | 107.078 | |
| A56 | | | | | 1.764.922 |
| Aq22-a | | | | | 5.354 |
| Aq22-b | | | | | 64.247 |
| Aq22-c | | | | | 37.477 |
I even had to duplicate some value to get what I need.
I create a dataset to get similar data as in excel so I get:
| 247808.0 | A12 | 1 |
| 144111.0 | A51 | 2 |
| 103698.0 | A52 | 2 |
| 144111.0 | A51 | 3 |
| 35178.0 | A53 | 3 |
| 68520.0 | A20 | 3 |
| 179288.0 | A19 | 4 |
| 34534.0 | A54 | 4 |
| 16736.0 | A55 | 4 |
| 17250.0 | A22 | 4 |
| 230558.0 | A56 | 5 |
| 836.0 | Aq22-a | 5 |
| 10031.0 | Aq22-b | 5 |
| 6382.0 | Aq22-c | 5 |
Then I try to get the chart using first column as series and second and third as categories, then I try to use the option split series using second category, but no luck.
Please can anybody help?