Hi,
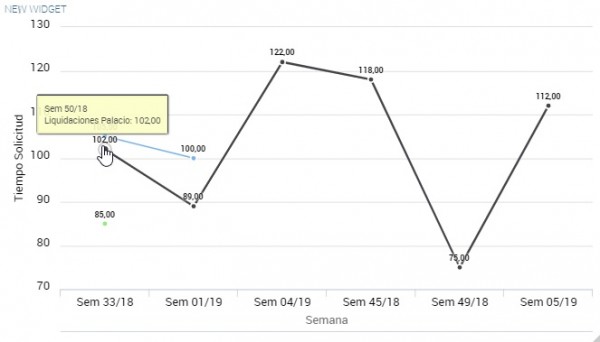
I am trying to make a line-chart report in which I can see the solution time of an application by branches and by week of the year. When it is just a branch it works good, but when it is two or more branches, the values of the line does not fit with the values of the week (X axis). Please see attached image where the pointed value says it belongs to week 50/18 (Sem 50/18), but it is displayed as part of week 33/18 (Sem 33/18) into the X axis, just because there is another value that do belongs to that week. Is there any configuration I am missing or could it be a bug from the 6.2.1 version? Thanks for the support.