Hi,
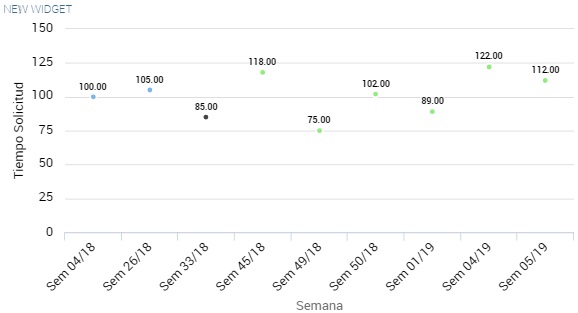
I am making a line-chart analysis with a second category. One serie and two categories, I enabled the option "second category". The data displays well, but in the chart just points are added, there is not line making the trend of my data. I am trying the new version 6.3.1, is that a bug? or any configuration I am missing?. Thanks for the support. Attached image.