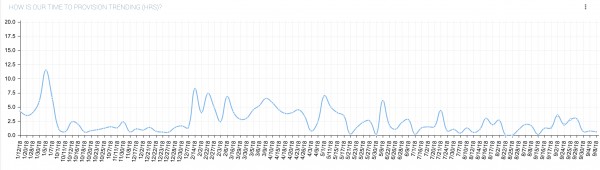
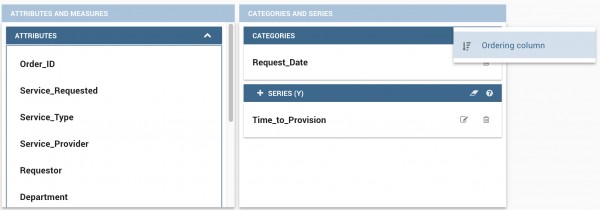
I am trying to create a line chart that shows avg time to provision over time. The issue I'm facing is that I am unable to allocate the column "Request_Date" as a date. When the line plots, the x-axis does not plot the date in sequential order. There seems like there is no option to set the column as a date. Please let me know if I am missing something.