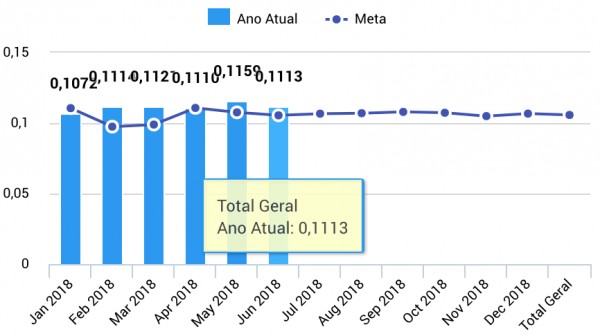
I have created a bar chart with 2 series. The idea is to have a "real" value and a "goal" value for the year. The "goal" value I have changed to line graph. At the end of the chart I have an average value for the "total" of the year.
The problem is that I still don't have all values for "real" value, but I have all "goal" values. So some of the "real" values are null.
When the chart is shown, the total value is shown in "Jun 2018" position instead of "Total Position" as shown in the attached image.
Is it possible to fix this?
Thanks and regards.