Hi to all,
I have a problem creting my chart report on knowage.
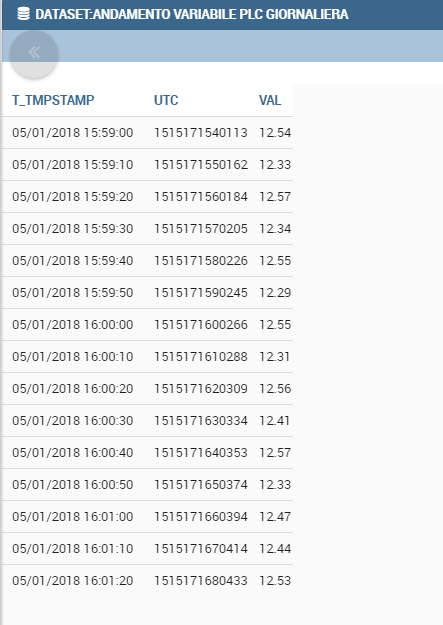
I create a dataset that extracting a timestamp field and a value. Executing the dataset on knowagem it works and return correct data,as you can see in the image below
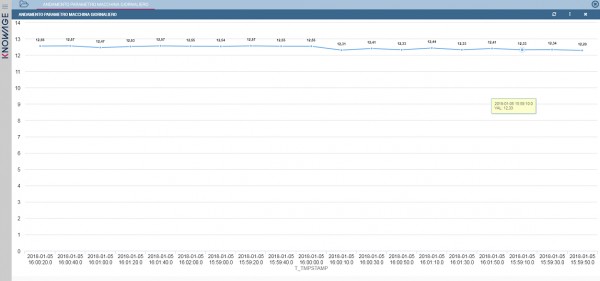
When I try to create my report, i select the timestamp field as attribute (category) and the value as measure.
The report works and the result is this:
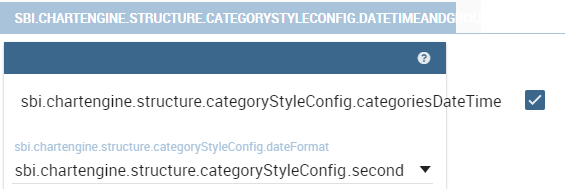
Now I'd like to set category axis as time category in order to have the possibility to have a zoom on timestamp (year,Month,Day,Hour,...). in SpagoBI I had this possibility, using a long value with the milliseconds value instead of timestamp, and defining category as datetime type directly in the xml.
In knowage it seems not works. I try to modify the date time and grouping parameters, setting them like that
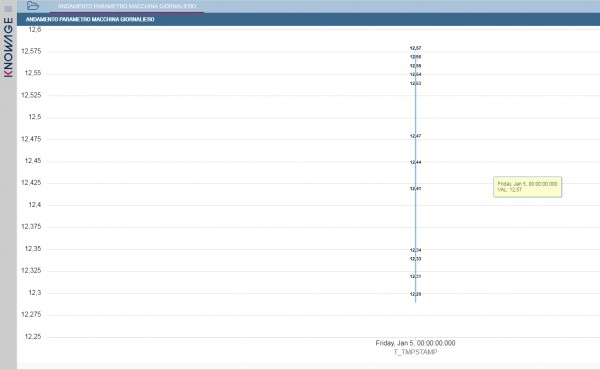
But the result is not what I want, in fact all the values are grouped by the same day, and the same time 00:00:00, it seems that it can't recognize hour:minute:second values.
Any Idea?
Thanks
Alessandro